
Programs for testing Linux. Testing hardware in Linux Screenshots of the LinX program
Sometimes it becomes necessary to perform a partial or full load of the microprocessor on a personal computer or server. This may be needed to stress test the system, to check the stability of operation, to evaluate the efficiency of the cooling system and to measure the power consumed by a computer or server under load.
The article presents designs from simple and always available console commands in GNU Linux, which can be used to load one or all processor cores. We will also consider a compact but very powerful package for stress tests for Linux, which can be installed with one command. Everything is detailed and with examples!
Power utilization of two CPU cores (40%+70%)
An experienced user of the GNU Linux operating system (OS) has more than once encountered cases where a simple command with a small error could load the microprocessor to capacity. This is what we will use, only we will have everything thought out and with a specific purpose.
First, consider a rather interesting combination of two separate commands connected through a pipeline (the "|" symbol, I/O redirection).
Dd if=/dev/urandom | bzip2 -9 > /dev/null
Its essence: we read random data from the file "/dev/urandom" using the "dd" utility, through the "|" pipeline we transfer this read data to the archiver program “bzip2”, specify the maximum compression level (9) and output this data to a “black hole”, that is, to nowhere - there is a special file “/dev/null” for this.
Thus, while the command is running (you can interrupt it by pressing CTRL+C), the archiver will compress a continuous stream of random data and send the result to an eternally empty file. Nothing is written to physical disks and file systems, and the processor has a lot of work to do.
This bunch of commands will load two CPU cores (Central Processor Unit) in this way:
- "dd if/dev/urandom" - will load one core by about 40%;
- "bzip2 -9" - will load the second core by about 70%.
To load additional microprocessor cores, you need to open additional terminal windows and run several clones of this command.
Monitoring the load on individual CPU cores
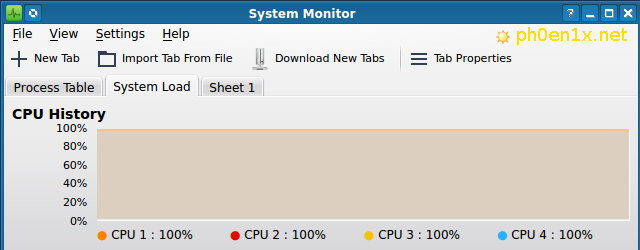
To conveniently monitor the load on each microprocessor core, you can use the "System Monitor" program, which is part of the KDE desktop environment. A program with similar functionality and the same name is also available in the GNOME environment.
Rice. 1. Monitor the load on two CPU cores in GNU Linux using System Monitor from KDE.
The figure shows the result of loading two cores with a combination of two commands, which were discussed above. One core is an orange graph (70%), the other core is a yellow graph (40%).
The "htop" utility, which should be familiar to almost every system administrator, does the same task, only in the console. If you do not have it installed, you can fix the situation with the command:
Sudo apt-get install htop
To launch this console resource monitor, use the command of the same name:
Below is an example of how this console resource monitor works; two kernels are loaded with the same combination of dd and bzip2 commands.
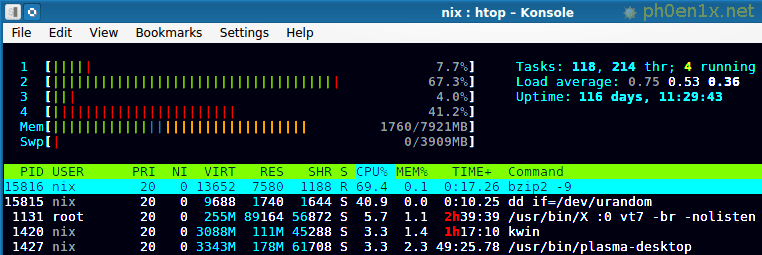
Rice. 2. Monitoring the load of two CPU cores in GNU Linux using HTOP.
What do the red and green marks in the progress bars for CPU cores mean in HTOP? - everything is as simple as shelling pears:
- green color - the amount of processor resources allocated for processes with normal priority;
- red color - CPU resources allocated to processes with kernel priority.
I wrote about how to find out the frequency of the installed microprocessor(s), core operating modes and other useful information in one of the previous articles about the CPU in GNU Linux.
Utilization of 100% of the power of one or more CPU cores
For this purpose, you can use commands that process a continuous stream of data at a very high speed, without periodic load fluctuations as is the case with bzip.
Let's tell the microprocessor "yes"... just too many times!
Yes > /dev/null
It looks like a simple and harmless command, but it will load one CPU core by approximately 100% and without surges. The essence of this design is simple: print the word “yes” an infinite number of times and redirect the output to the “black hole” - /dev/null.

Rice. 3. Load one CPU core 100% with the yes command in GNU Linux.
Other combinations of simple commands for loading the CPU
The example with the "yes" command is the simplest and most accessible way to load one or more CPU cores.
You can also experiment with other commands and programs that are available by default in almost every GNU Linux distribution.
The essence of constructing such combinations of commands is as follows:
- We are constantly reading something from somewhere and redirecting it to /dev/null;
- We carry out endless data analysis with some program or utility.
The following combination allows you to load one core to the very ceiling:
Cat /dev/zero > /dev/null

Rice. 4. We load one CPU core to the maximum of 100% with the cat command in GNU Linux.
The essence of the command: using the "cat" command, we output an endless stream of data from the pseudo-device "/dev/zero" (generates zeros, 000) into the void "/dev/null";
As we can see, our process runs with high priority (OS kernel priority) and requires the entire computing power of one processor core to execute.
You can use the "dd" program to read data from a pseudo-device file.
Dd if=/dev/urandom of=/dev/null
The essence of the command: using the “dd” program (if - input file, of - output file) we read a stream of random data from /dev/urandom and send it to “nowhere” - /dev/null.
The result of monitoring the core load in HTOP will be the same as in Figure 4.
Now let’s load the processor by calculating the checksum of an endless file with zeros:
Sha1sum /dev/zero
In htop we can see the same thing in Figure 3, although the loading density will be more stable.
We load the CPU by calculating the MD5 sum of an endless stream of random data:
Md5sum /dev/urandom
The loading schedule will be identical to that in Figure 4, the microprocessor is loaded with a process that runs at the OS kernel level, very high priority.
We load the processor 100% using pbzip2
At the beginning of the article, an example was presented with bzip2, which individually can load one microprocessor core. There is also a multi-threaded implementation of this archiver - pbzip2.
You can install pbzip2 with the command:
Apt-get install pbzip2
To load all available processor resources, just run the following command:
Cat /dev/zero | pbzip2 -c > /dev/null
Instead of the stream source "/dev/zero", you can use "/dev/urandom" or create an even simpler construction:
Yes | pbzip2 -c > /dev/null
Stress - a package of comprehensive PC load tests
I already wrote about using the “stress” utility in GNU Linux in an article about self-repairing a PC. There it was used in conjunction with other programs to obtain a load stress set similar to AIDA64 for Windows.
With this program, you can load all available CPU cores at once, or you can specify exactly how many cores should work hard. To install the "stress" package, just run the command:
Sudo apt-get install stress
So, we run the program with instructions to load 4 microprocessor cores:
Stress --cpu 4
The performance results are shown below.
Rice. 5. We load all CPU cores to the maximum 100% with the stress command in GNU Linux.

Rice. 6. We look at the result of the stress program in htop.
Finally
As you can see, loading a single processor core or several cores without installing special software in GNU Linux is a fairly simple task. Everyone can choose a bunch of commands that are easy to remember and use, and besides, knowing the principle of operation, you can literally build such combinations yourself on the fly.
However, by installing the "stress" program, you can solve the problem comprehensively and with additional capabilities. You can also use a software package such as "phoronix-test-suite" for load and tests, but that's a different story...
A benchmark is a measurement of the maximum performance of a computer, which is expressed in arbitrary points. Thanks to this, you can compare the performance of different computers, or the same computer after, for example, overclocking or undervolting.
A benchmark and a stress test are not the same thing. Both during the benchmark and during the stress test, the system receives full load. But the main purpose of benchmarking is to evaluate performance, and the main purpose of a stress test is to check whether the system can function at its maximum load, or to determine this limit. Although, in fact, some programs combine both functions.
The benchmark can be performed for the system as a whole, or for its individual components: the central processor, video card, I/O system.
Linux has several programs for evaluating the performance of the central processor, for example: sysbench, stress-ng And phoronix-test-suite. Of them stress-ng primarily performs the functions of a stress test, but it displays the resulting metrics, so it is quite suitable for assessing and comparing system performance.
Benchmark in sysbench
sysbench is a command line utility. It was created to evaluate the performance of servers with heavily loaded DBMSs, but is also suitable for benchmarking conventional systems.
Installation on Ubuntu, Linux Mint, Debian, Kali Linux:
Sudo apt install sysbench
Tests built into the program:
- fileio— File I/O testing
- CPU— CPU performance testing
- memory— Testing the speed of memory functions
- threads— Testing the performance of the thread subsystem
- mutex- Mutex performance test
To run a CPU performance test:
Sysbench cpu run
Pay attention to how the program is launched: at the beginning there is the name of the test, then the options (there are none in the first example), and then the command.
There are two execution limits for the program:
- 10,000 operations with numbers
- 10 seconds execution
Depending on what comes first, the program will terminate either after 10,000 events or after 10 seconds.
Modern processors are very powerful, and if the program ends very quickly, the data may be corrupted. For example, when assessing processor performance, throttling (frequency reset) plays a role. Throttling begins due to overheating or exceeding TDP. These effects are observed only over long distances of processor operation. If, for example, the test completed in a second and you received n processed operations, this does not mean that the processor will complete 60*n operations as it will drop frequencies due to overheating and exceeding the heat dissipation limits set in the TDP.
For longer test execution, use the options –cpu-max-prime And –time. The first sets the maximum number of operations performed, and the second sets the maximum time for the benchmark. When using options simultaneously, priority takes place –time.
Modern central processors are multi-core and multi-threaded:
Default sysbench runs in one thread. Therefore, if you want to use all the cores of your processor, use the option –threads. I have 6 physical and 12 logical CPU cores, so I will use the value 12 to ensure that all processors are running.
When using the option –cpu-max-prime, the shorter the program completion time, the more productive the central processor:
Sysbench cpu --threads=12 --cpu-max-prime=100000 run
The program completed its work too quickly - in 10 seconds it is unlikely that the processor had time to undergo serious throttling. Therefore, with these values, the test is suitable for assessing peak performance over a short distance.
Results received:
CPU speed: events per second: 538.23 General statistics: total time: 10.0188s total number of events: 5393 Latency (ms): min: 19.85 avg: 22.27 max: 30.56 95th percentile: 23.10 sum: 120125.61 Threads fairness: events (avg/ stddev): 449.4167/4.11 execution time (avg/stddev): 10.0105/0.01

CPU speed events per second means the number of operations performed on the central processor per second - the higher the value, the more productive the system.
General statistics total time means the total execution time of operations.
General statistics total number of events means the total number of completed events.
If the system shuts down too quickly, you can increase the value to, for example, two hundred thousand events:
Sysbench cpu --cpu-max-prime=200000 run
Another way to check throttling and evaluate processor performance under long-term load is to set the execution time; in the example below, the time is set to 300 seconds.
Sysbench cpu --threads=12 --time=300 run
When I use the options –time And –cpu-max-prime CPU speed events per second differs tenfold - apparently either some bug in the program, or the program calculates according to some other rules.
Benchmark in phoronix-test-suite
Install the program:
Sudo apt install phoronix-test-suite
Run it - for the first time you will need to accept the license agreement, so the program will ask permission to send anonymous statistics:
Phoronix-test-suite list-available-suites
The previous command will list the available benchmarks.
Available kits in Phoronix Test Suite v8.0.1
Pts/audio-encoding - Audio Encoding System pts/chess - Chess Test Suite Processor pts/compilation - Timed Code Compilation Processor pts/compiler - Compiler Processor pts/compression - Timed File Compression Processor pts/computational - Computational Test Suite System pts/computational -biology - Computational Biology Test Suite Processor pts/cpu - CPU / Processor Suite Processor pts/cryptography - Cryptography Processor pts/daily-kernel-tracker - Daily Kernel Tracker System pts/daily-system-tracker - Daily System Tracker System pts/database - Database Test Suite System pts/desktop-graphics - Desktop Graphics System pts/disk - Disk Test Suite Disk pts/encoding - Encoding System pts/favorites - Favorites System * pts/gaming - Gaming System pts/gaming-closed - Closed-Source Gaming System * pts/gaming-free - Free Software Gaming System pts/gui-toolkits - GUI Toolkits Graphics pts/ioquake3-games - Games Using The ioquake3 Engine System pts/iqc - Image Quality Comparison Suite Graphics pts/java - Java System pts /java-opengl - Java OpenGL System pts/kernel - Kernel System pts/linux-system - Linux System System pts/machine-learning - Machine Learning System pts/memory - Memory Test Suite Memory pts/mesa - Mesa Test Suite Graphics pts/ motherboard - Motherboard System pts/multicore - Multi-Core Processor pts/netbook - Netbook Test Suite System pts/network - Networking Test Suite Network pts/nevada - OpenSolaris Nevada Test Suite System pts/opencl - OpenCL System pts/opengl-demos - OpenGL Demos Test Suite System pts/opengl-workstation - OpenGL Workstation Test Suite System pts/pts-desktop-live - PTS Desktop Live System pts/ray-tracing - Ray-Tracing Test Suite System pts/server - Server Motherboard System pts/ue4 - Unreal Engine 4 Tech Demos On Linux Graphics pts/unigine - Unigine Test Suite Graphics * pts/universe - Universe Test Suite System pts/universe-cli - Universe CLI Test Suite System * pts/universe-x - Universe X Test Suite System pts/ video-encoding - Video Encoding System pts/workstation - Workstation System pts/workstation-graphics - Workstation Graphics Graphics pts/xrender - X Render Extension Testing Graphics system/collection - Collection System
Partially supported sets are marked with an asterisk.
To run a CPU performance assessment, run:
Phoronix-test-suite run pts/cpu
Please note that pts/cpu and other benchmarks take up several gigabytes of disk space. For example, pts/cpu will download about 3 GB of data and will use approximately 7 GB of disk space (in the user's home directory).
See how to monitor the current processor frequency and temperature in Linux.
Linx is a utility used to test system stability. In essence, it is a graphical shell for the Linkpack test, capable of pushing the processor to the limit. Linx is usually used to test CPU overclocking; if the test is successful and the temperature remains within normal limits, overclocking can be left.
Linx main window
Program features:

How to Use Linx to Test Overclocking Stability
- We launch the program, in the settings we set the required number of threads and 32\64 bit mode. We check that the checkbox is checked - stop if there is an error.
- Optionally, connect Everest (now Aida64) or Speedfan, set the maximum temperature.
- In the main program window, select all available RAM
- We launch 1 test run, based on the time it took, and set the number of repetitions so that the test lasts at least an hour.
- We run the test with repetitions, monitor the temperature and wait.
- If the test fails, we check the maximum temperature, voltage and other parameters, select more suitable ones and repeat the testing.
In order to properly test the processor cooling system and the stability of operation during overclocking, when in order to achieve high frequencies you also have to increase the voltage, you need to load it to capacity for quite a long time. Only special utilities that can load the processor to capacity with complex but meaningless calculations will help with this. The main thing here is to take the “right” program so that it works effectively, using complex floating point formulas to process large amounts of data. Perhaps one of the best utilities was created by Intel, called Linpack. True, programmers made it for advanced users, without bothering with windows with frills, limiting themselves to the command line. A black screen with incomprehensible running lines drives ordinary computer users into a stupor, who do not understand what to do with them and where to click the mouse. Thank God there were kind people who attached a graphical shell to Linpack, calling their creation LinX.
 LinX will not have to be installed, but you will need to download the archive file, unpack it, go to the created folder and run the executable file LinX.exe. To remove the program, it will be enough to delete the folder where the LinX files were dropped, the main thing is not to forget what it is called and where it is located.
The fact that Intel is behind the creation of the tests does not require you to worry about the efficiency of working with AMD processors; LinX perfectly loads both Intel and AMD processors.
After launching LinX, the program is actually ready to work; just click the “Start” button at the top right side. Then we must be patient and wait until the specified number of tests have passed in a circle. When each test cycle is completed, its results will be added to the table, namely the time spent, data processing speed, the number of threads used and the size of the matrix of the system of linear equations that was used for calculations. At a time, loading the processor to the maximum, allowing you to check its stability and the efficiency of heat removal by the cooling system.
To stop running tests, just press “top”.
In the main window in the top line below the main menu there are sections where users can change:
- “Problem scope:”, indicate the size of the matrix of the system of linear equations that will be used for calculations. The more, the longer the calculations take. Please note that this parameter is linked to “Memory”, that is, if you change one of them, the other will automatically change.
- “Memory (Mib)”, the amount of RAM that the program can use. As mentioned above, when the volume increases, the “Task Volume:” will automatically change, and vice versa.
- “Run” how many test runs will be done in a circle.
 Among the interesting features of the program, it is worth noting the support for obtaining data on processor temperature, core frequencies and supply voltage from the Everest / Speedfan applications and displaying them in the form of graphics during tests. Plus allow stopping tests if errors occur or if the processor heats up above a specified value (only when working in a pair of Everest / Speedfan). Also in the settings you can set the number of threads that will be executed simultaneously, select the test bit depth of 32 or 64-bit, the priority of testing processes (it is better to leave it at default so that the computer does not slow down), and limit the amount of program memory used so that the operating system does not slowed down.
Today, LinX, or to be more precise, Linpack if you remove the graphical shell, is the only test that allows you to most adequately check the stability of the processor. Please note that this program creates very high loads on the processor, under which it would never work at home, and it is not advisable to constantly run it on your computer for several hours. Especially in light of the fact that all Intel processors of the latest generations have thermal gum under the lid, which, with prolonged exposure to high temperatures, can lose its properties over time.

The program works in both 32 and 64 bit operating systems. The program interface has been translated into English and Russian; users must download the required version of the program with the appropriate localization.
It will cope when the processor load reaches 100 percent. This way, cooling problems can be identified and resolved before they become a real problem. In this material we will talk about how to conduct a processor stress test using LinX and OCCT programs.
One of the most famous processor stress testing programs is LinX. This program is completely free and is a graphical interface for the Linpack program developed by Intel. Using this program, you can create a maximum load on the processor and thereby find out to what temperature the processor will warm up.
In order to conduct a processor stress test using LinX on your computer, unzip it to any folder and run the LinX.exe file. After launching the program, you will see a window similar to the one in the screenshot below. There are two buttons “Start” and “Stop” with their help you can start and stop the stress test.
But don't rush to launch LinX. You will also need some. You can use HWmonitor for this purpose. This program is designed to monitor the current system parameters. With its help you can monitor temperatures, load, cooler rotation speed and much more.
Install and run on your computer. Once launched, scroll through the list of parameters that HWmonitor monitors down to CPU parameters. When stress testing, you need to pay attention to the rotation speed of the coolers, temperature and processor clock speed.

Once everything is ready, you can run the LinX stress test. To do this, you just need to click on the “Start” button.

After starting stress testing, we begin to monitor the processor temperature in the HWmonitor program. If the processor cooling system is working properly, then at first the temperature will increase sharply, but after the fans spin up to full power, it should decrease and stabilize at the same level. The screenshot below shows that the temperature first jumped to 80 degrees (Max column), and then dropped to 72 degrees (Value column).

If the processor cooling system is faulty or it simply cannot handle the heat, then the temperature will continue to rise throughout the stress test. If the temperature exceeds 80 degrees and continues to increase, then it is better to interrupt testing so as not to force the computer into an emergency reboot.
To turn off the stress test, simply click on the “Stop” button in the LinX program. If the computer is frozen and the Stop button does not work, then restart the computer using the Reset button on the system unit.
CPU Testing with OCCT
OCCT is another very popular CPU stress testing program. OCCT is equipped with two processor testing algorithms. This is Linpack, which is used in LinX, as well as its own OCCT algorithm. At the same time, OCCT is equipped with a more advanced interface. It can be used to monitor temperature, load and other processor parameters. So when testing using OCCT, the HWmonitor program is no longer needed.
To conduct a processor stress test using OCCT, install and run it on your computer. Next, you need to go to the tab of the test that you want to use and click on the “ON” button.


Then everything is exactly the same as with LinX. If the processor cooling system is working properly, the temperature will first jump, and then drop and stabilize at some point. If the cooling system is faulty or cannot cope with the load, the temperature will continue to rise. In this case, the stress test must be stopped.